> ## Documentation Index
> Fetch the complete documentation index at: https://enterprise-docs.dify.ai/llms.txt
> Use this file to discover all available pages before exploring further.
# Dashboard
> Monitor performance, costs, and user engagement through Dify's built-in analytics dashboard
The dashboard tracks four metrics over time to show how your application performs:
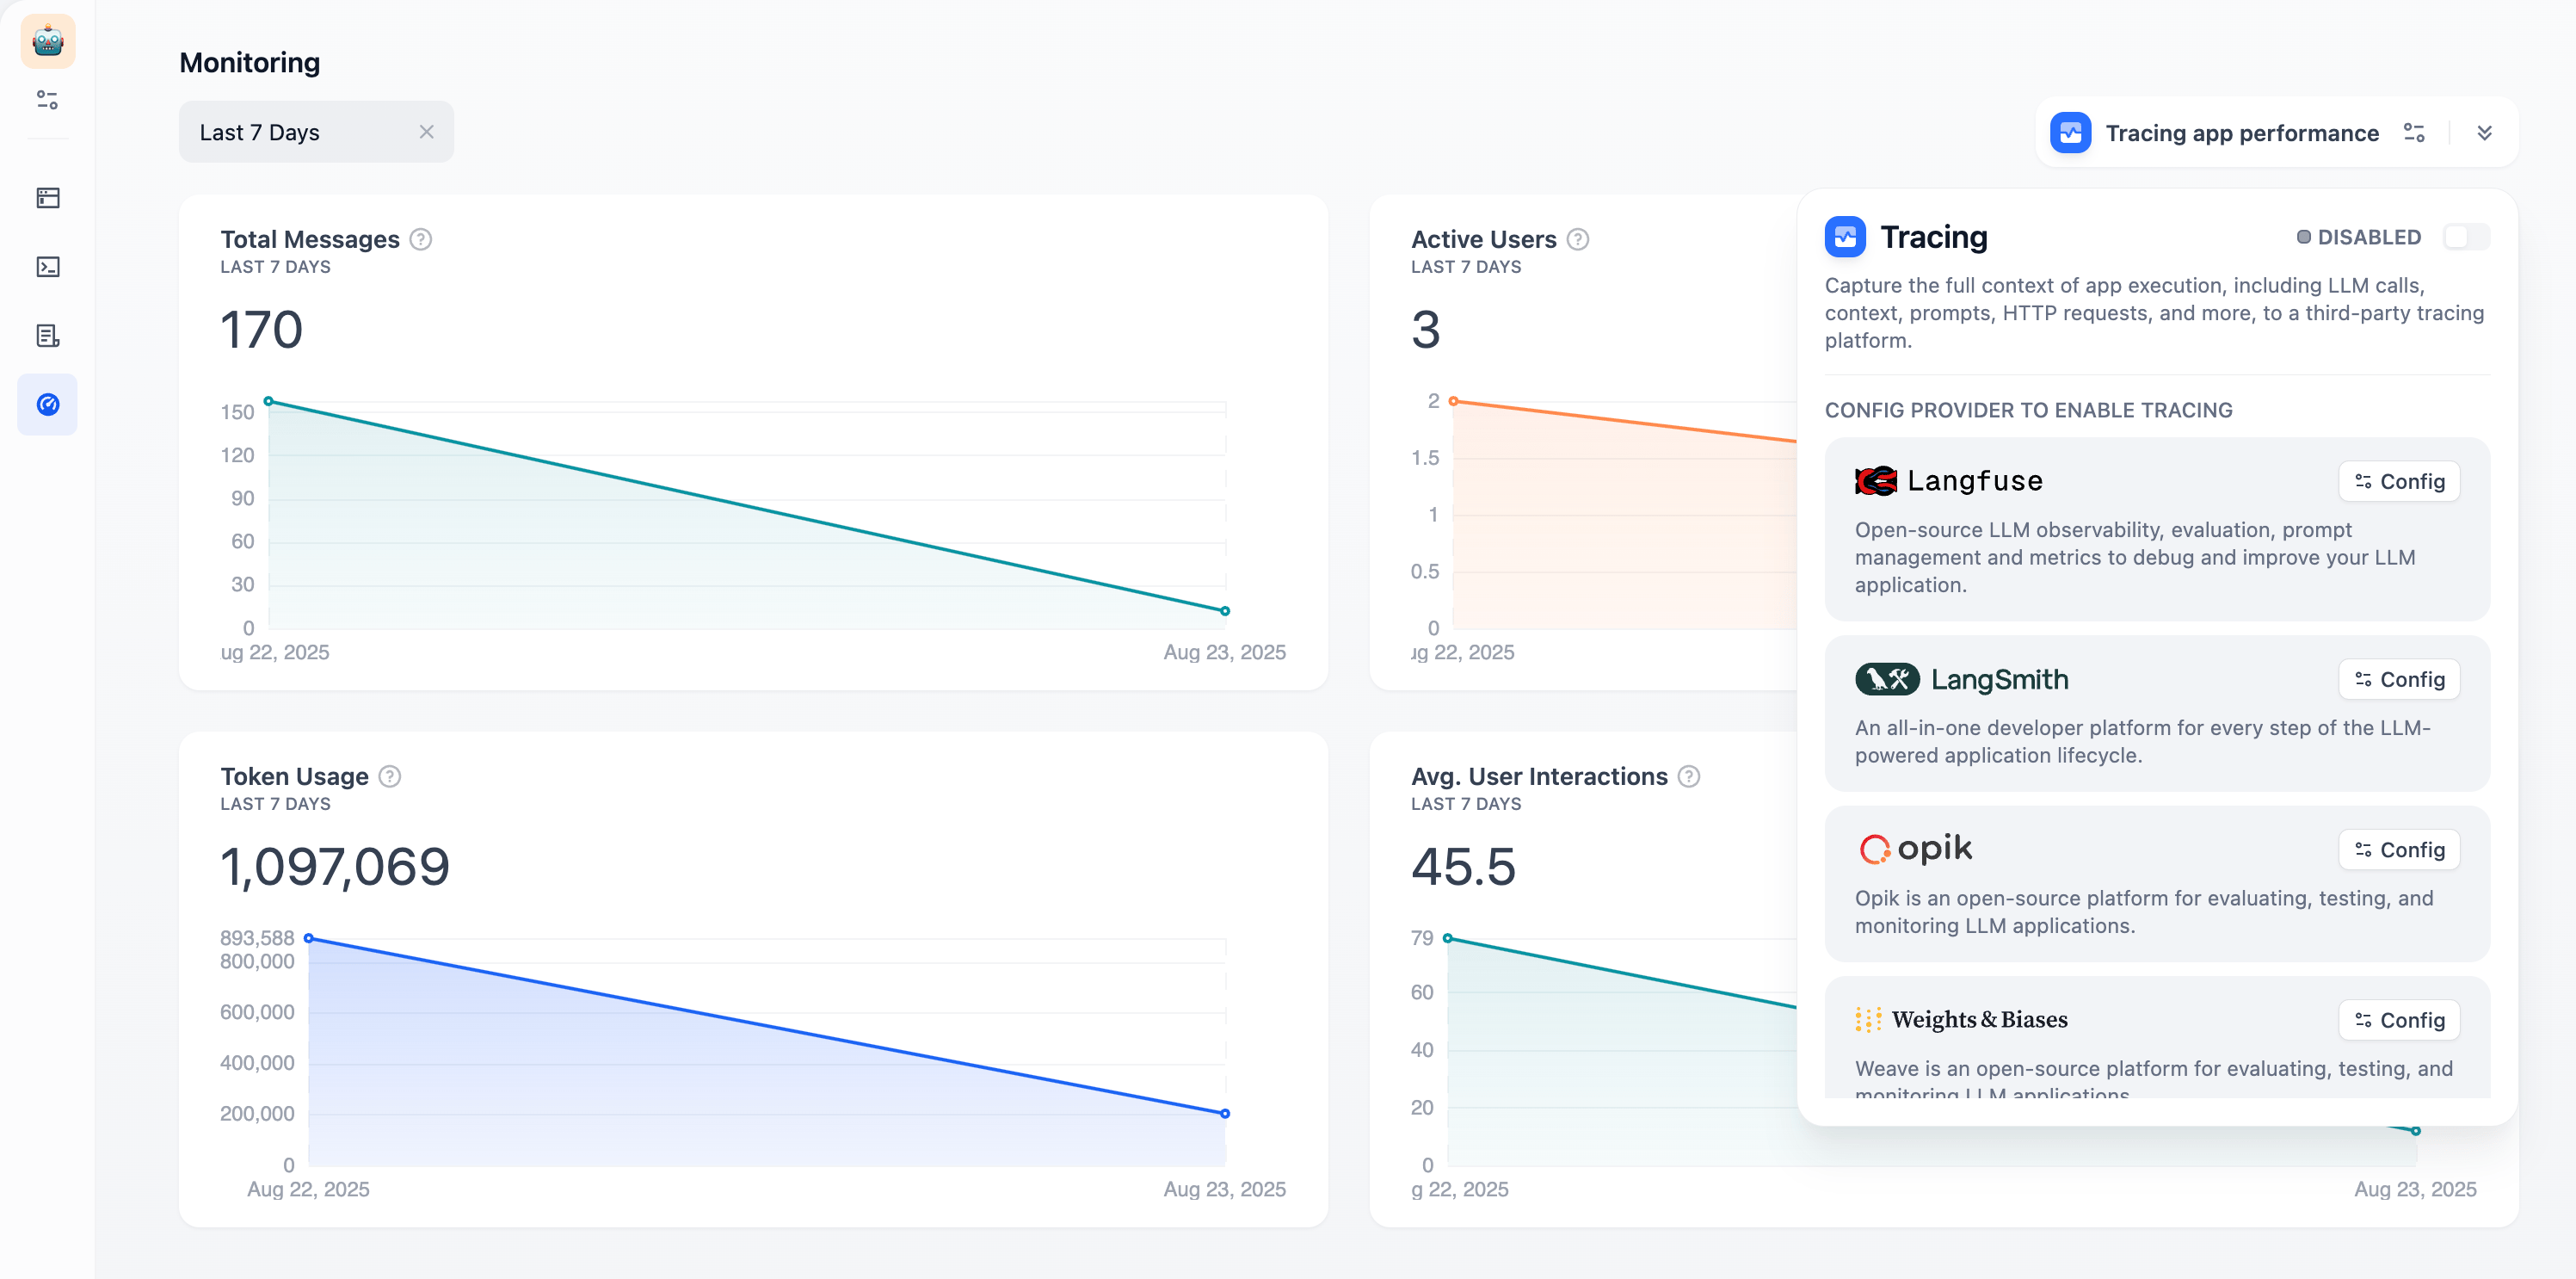 **Total Messages**: Conversation volume\
**Active Users**: Users with meaningful interactions (more than one exchange)\
**Average User Interactions**: Engagement depth per session\
**Token Usage**: Resource consumption and costs
Use the time selector to view trends over different periods. Click **"Tracing app performance"** to connect external observability platforms like Langfuse or LangSmith for deeper analytics.
**Total Messages**: Conversation volume\
**Active Users**: Users with meaningful interactions (more than one exchange)\
**Average User Interactions**: Engagement depth per session\
**Token Usage**: Resource consumption and costs
Use the time selector to view trends over different periods. Click **"Tracing app performance"** to connect external observability platforms like Langfuse or LangSmith for deeper analytics.